COMPARISON
OpX vs spreadsheets.
Most CI programmes run on spreadsheets. They're flexible, free, and familiar — and they break the moment improvement spreads beyond one team.
Where spreadsheets work
- One-team, one-site CI initiatives
- Quick prototypes and experiments
- Low-stakes tracking with no audit requirement
- Solo CI lead with full mental model of all activity


Where spreadsheets fail
- Cross-team / cross-site visibility
- Governance and audit trails
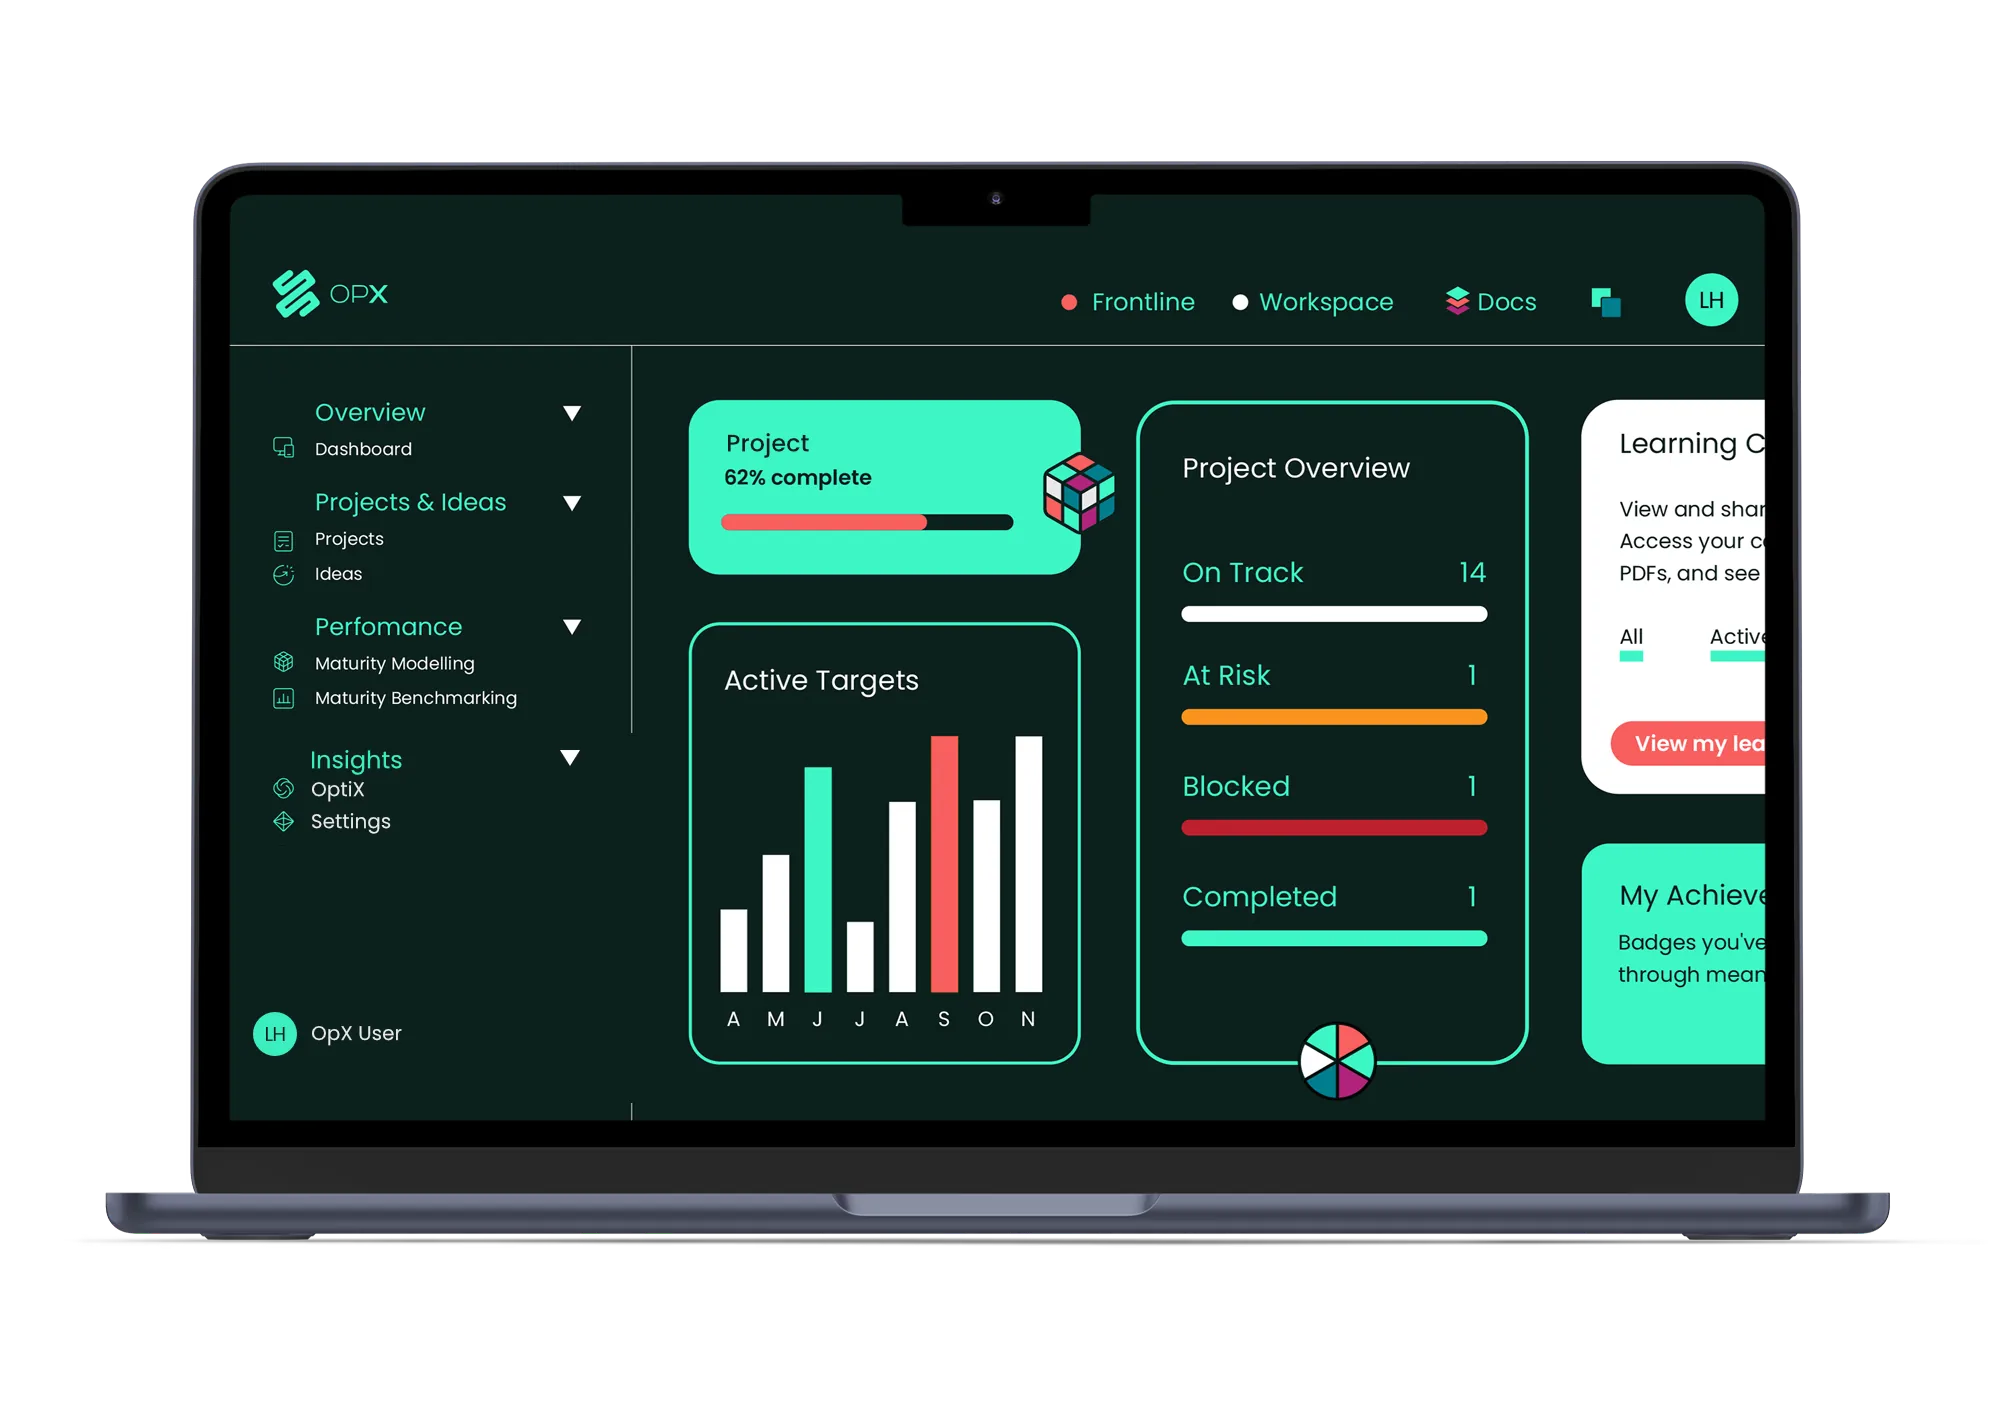
- Real-time dashboards
- Capability tracking at scale
- Anything that needs to survive a personnel change
- Multi-tenant access control
Side by side
| Capability | Spreadsheet | OpX |
|---|---|---|
| Visibility | Individual file | Live dashboards across teams/sites |
| Audit trail | None | Built in, per-tenant |
| Capability tracking | Static matrix | Live database with monthly sync |
| Governance | Meeting minutes | Workflow-based, audit-trailed |
| Maintenance burden | Permanent CI lead overhead | Vendor-managed |
| Time to a status report | Hours per cycle | Real-time |
| Multi-user editing | Conflict-prone | Native, role-based |
| Data export on exit | The file you have | Structured export, no fee |
- Capability
- Visibility
- Spreadsheet
- Individual file
- OpX
- Live dashboards across teams/sites
- Capability
- Audit trail
- Spreadsheet
- None
- OpX
- Built in, per-tenant
- Capability
- Capability tracking
- Spreadsheet
- Static matrix
- OpX
- Live database with monthly sync
- Capability
- Governance
- Spreadsheet
- Meeting minutes
- OpX
- Workflow-based, audit-trailed
- Capability
- Maintenance burden
- Spreadsheet
- Permanent CI lead overhead
- OpX
- Vendor-managed
- Capability
- Time to a status report
- Spreadsheet
- Hours per cycle
- OpX
- Real-time
- Capability
- Multi-user editing
- Spreadsheet
- Conflict-prone
- OpX
- Native, role-based
- Capability
- Data export on exit
- Spreadsheet
- The file you have
- OpX
- Structured export, no fee
Honest cost comparison
A spreadsheet looks free. The actual cost is (a) the CI lead's time spent maintaining and assembling, and (b) the value leakage from poor visibility. For most improvement programmes, this is £40k–£100k of hidden cost per year per CI lead.
Calculate your cost →